Chapter 8 Plotting
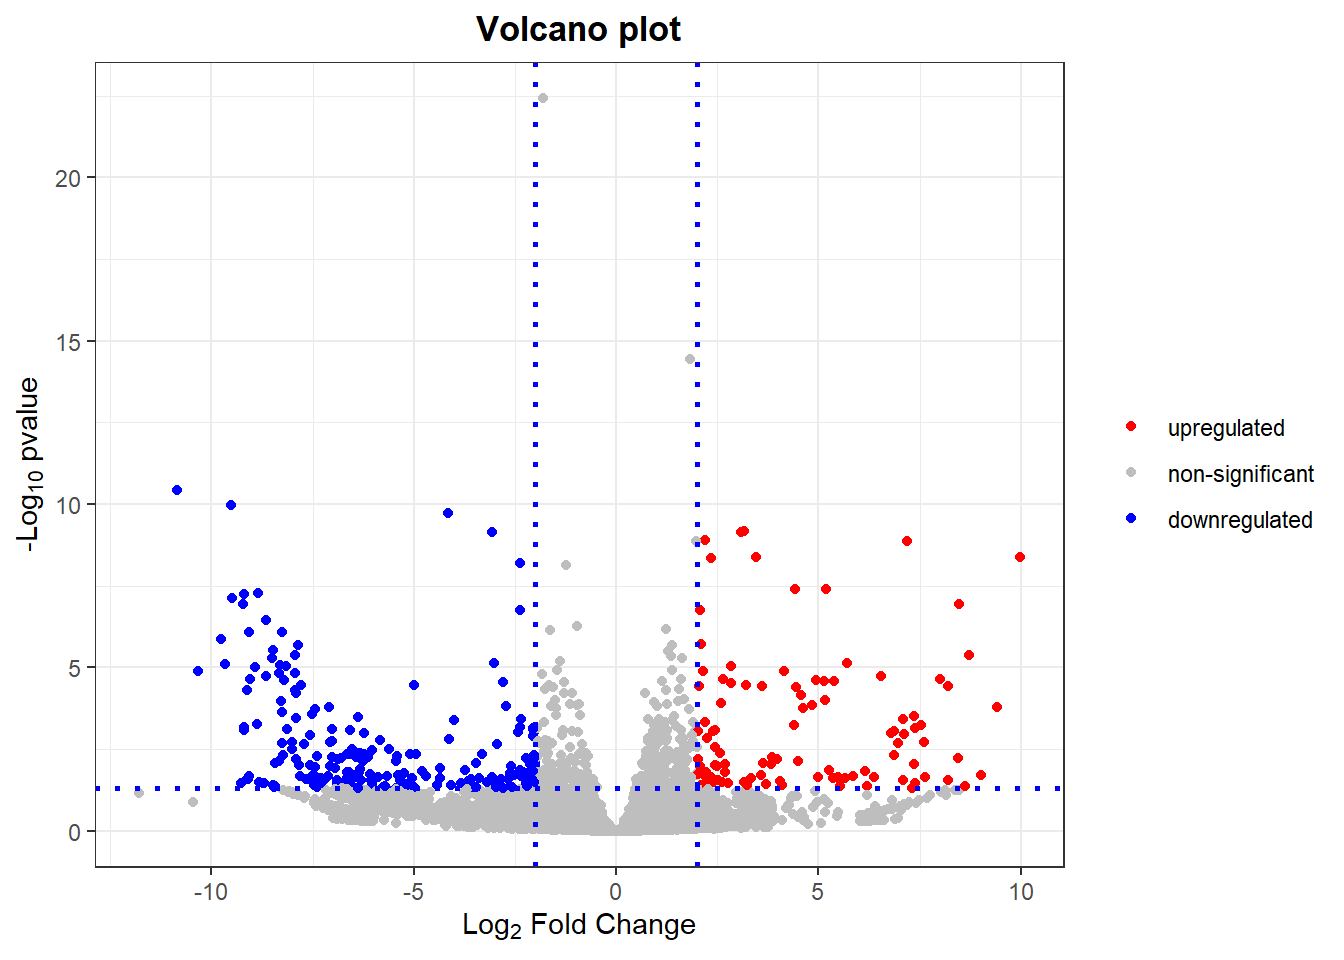
Just like differential abundance, volcano plots are great to explore differential expression results. Volcano plots will be obtained again using the plot_volcano() function.
res_df <- as.data.frame(res) %>%
  rownames_to_column(var = 'FeatureID') %>%
  drop_na()

volcano <- plot_volcano(res_df,
                        column_with_log2FC = log2FoldChange,
                        column_with_pval = padj,
                        log2FC.threshold = 2,
                        pval.threshold = 0.05)

volcano
Figure 8.1: Volcano plot of transcriptomics data